Espanhol
 Português

-
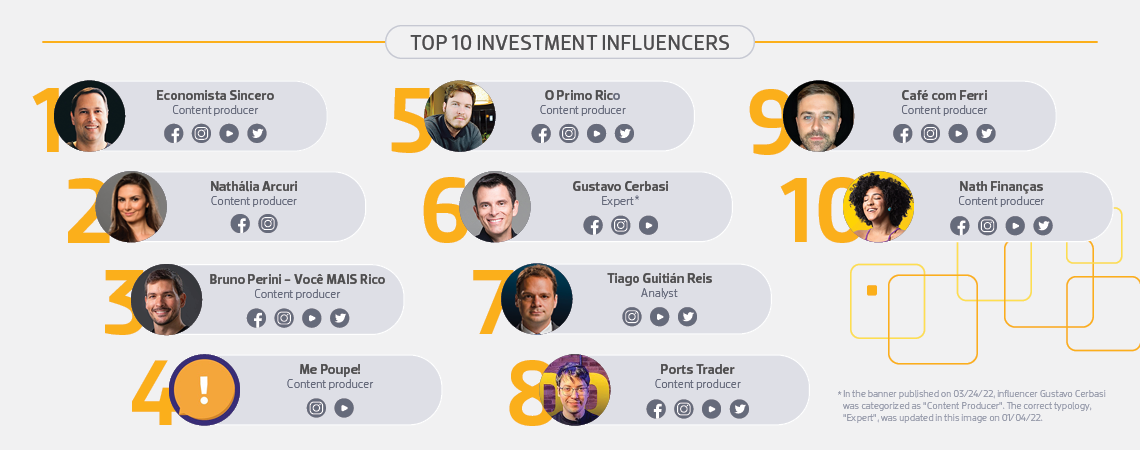
RANKING Based on a methodology created exclusively to measure the influence of these personas, below is our ranking of the top ten investment influencers on social media. The data were cross-checked among the different platforms, and statistical calculations were made regarding the criteria of popularity, authority, articulation, commitment, and average engagement of the active social media of each influencer.
The calculations consider public data from influencer profiles on social media. There are certain data on engagement and audience that are private, which only the profile owner has access to; in these cases, we cannot access such information, so it was not used in the calculations. For further details about the methodology, including the formula used, see page 54 of the report.
-
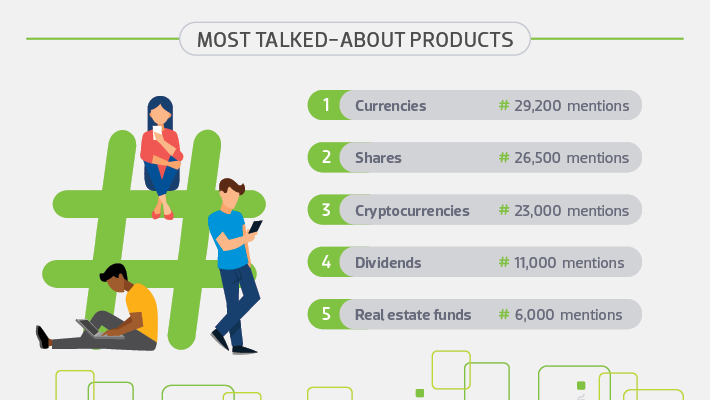
MOST TALKED-ABOUT PRODUCTS Influencers devoted more time to addressing financial products, which were mentioned 107,000 times during the period monitored – a 12% increase in average daily mentions over the first edition of this study. Audiences are particularly engaged with this type of content: they generated an average of 1,648 interactions, a number 44.5% higher than the general average of interactions in general investment-related posts.
-
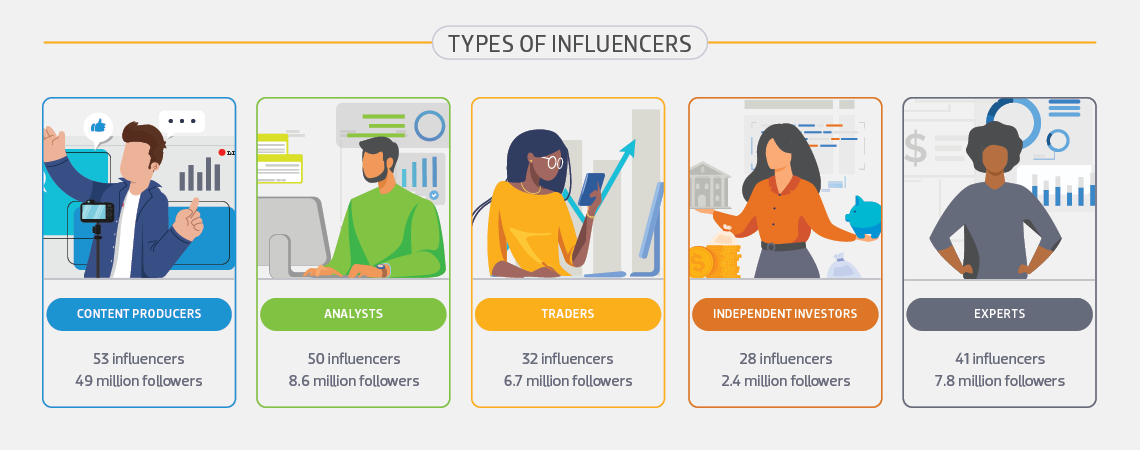
TYPES OF INFLUENCERS As in the first edition, the influencers were divided into 11 different types, for the purpose of monitoring, considering how they declare themselves to their followers and how they behave in their posts. Five profiles stand out from the rest because they have the highest level of engagement, on average, and account for 59% of the content analyzed:
-
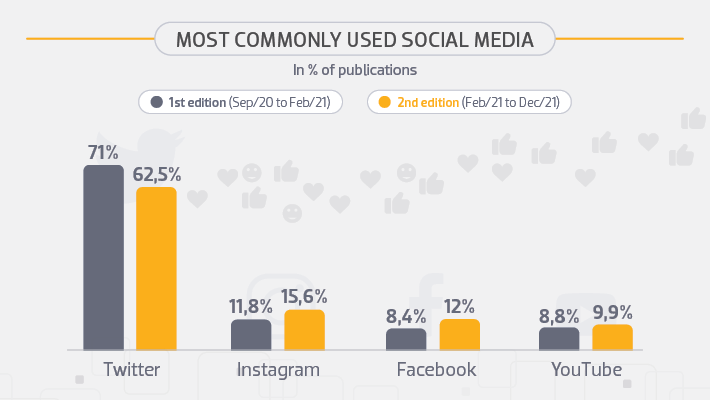
PREFERRED SOCIAL MEDIA Twitter held on to its lead as the social media of choice, accounting for more than six out of 10 posts – although it showed a downturn compared to the previous edition. The practicality of publishing, which allows for ad hoc comments and quick posts, explains its popularity. Instagram was the platform with the highest growth proportionally between the last edition and this one: nearly four percent.
-