Espanhol
 Português
Mutual funds outflows reach R$47.2 billion in May
The mutual fund industry had net outflows of R$47.2 billion in May, raising losses to R$158.9 billion in the year and above the net selling seen in 2022. It’s the seventh consecutive period of monthly losses and outflows for the top asset classes.
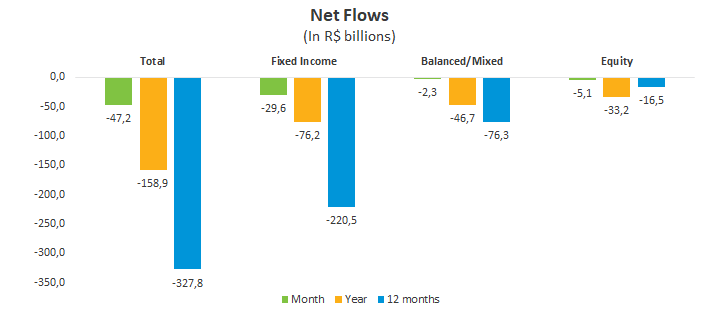
Fixed income had the worst figures, bleeding R$29.6 billion. Next came the FIDCs, with net selling of R$13.3 billion, but the amount was concentrated in a single redemption. As in April, among the 16 types of fixed-income portfolios, 11 experienced outflows. The three fixed-income types with the largest assets saw total losses of R$24.6 billion: Free Duration/Investment Grade (R$11 billion); and Short Duration/Investment Grade and Short Duration/Sovereign, with R$6.8 billion each.
The significant amounts flowing out of fixed income – losses have surged to R$220.5 billion in 12 months – were driven by redemptions in specific segments. In the year through April, middle market leads with R$16.1 billion in net selling, followed by high-income retail and account & order, with outflows of R$15.6 billion and R$14 .1 billion, respectively. The private (-R$10.7 billion) and traditional retail segments (-R$4.7 billion) also faced outflows.
Investors pulled R$2.3 billion from the Balanced/Mixed class, which had been suffering average monthly outflows of R$11 billion until April. The Balanced/Mixed Macro saw the worst net selling (R$3.5 billion), while the Balanced/Mixed Free, with the largest assets in the class, saw inflows of R$2.3 billion but still faces losses totaling R$13.1 billion for the year. Balanced/Mixed shows redemptions of R$46.7 billion in 2023 and of R$76.3 billion in 12 months.
The Equity class had outflows of R$5.1 billion, mostly driven by the Equity – Free Portfolio, with net selling of R$3.4 billion in May. In the year and 12 months, losses total R$33.1 billion and R$16.5 billion, respectively.
Among types with the largest assets in Fixed Income, there were gains for the Short Duration/Sovereign (1.09%) and Short Duration/Investment Grade (1.12%). Free Duration/Sovereign and Investment Grade rose 1.19% and 1.22%, respectively. In the Balanced/Mixed, the Free type returned 1.31%, while among the Equity class, the Free Portfolio, the most representative type, gained 6.8% in May, the best result since last October.